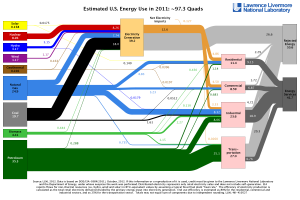
Americans used less energy overall in 2011 than in 2010 due mainly to reductions in the amount of energy wasted, along with natural gas and renewable sources increasing, and coal declining. The findings were published in an annual accounting of national energy supply and demand by Lawrence Livermore National Laboratory, based on data from the Department of Energy’s Energy Information Administration.
Overall, U.S. energy use in 2011 — see chart below — equaled 97.3 quadrillion British Thermal Units, or quads compared to the 98 quads used in 2010. Livermore Lab calculates 41.7 quads or 43 percent of the energy supplied in 2011 went into productive energy services for the residential, commercial, industrial, or transportation sectors. In 2010, 41.9 quads of energy were consumed by these sectors.
The remaining 55.6 quads or 57 percent of the energy supplied in 2011 is classified as rejected, or wasted, energy. In 2010, the U.S. rejected more energy — 56.1 quads — which was still 57 percent of the total energy supplied. Thus the bulk of the overall decline in energy from 2010 to 2011 in the U.S. — 0.5 of the 0.7 quads — appears to result from less rejected or wasted energy.
Coal, natural gas, and petroleum accounted for 79.9 quads or 82 percent of the total energy supplied in 2011, but the mix of those fossil fuel sources changed from 2010. Use of coal dropped from 20.8 quads in 2010 to 19.7 quads in 2011, a decline of 1.1 quads or 5 percent. Petroleum, used mainly as a transportation fuel, also declined from 36 to 35.3 quads in 2010, a 2 percent drop. Natural gas, on the other hand, increased somewhat from 24.7 quads in 2010 to 24.9 in 2011.
“Sustained low natural gas prices have prompted a shift from coal to gas in the electricity generating sector,” says Livermore Lab energy analyst A.J. Simon who prepares the annual charts. “Sustained high oil prices have likely driven the decline in oil use over the past five years as people choose to drive less and purchase automobiles that get more miles per gallon.”
Non-fossil fuel supplies, except for nuclear, all increased from 2010 to 2011. Hydroelectric and wind-generated electricity showed large percentage increases from 2010 to 2011. Hydro increased from 2.5 quads in 2010 to 3.2 quads in 2011, a 28 percent increase. Wind-powered electricity jumped from 0.9 to 1.2 quads, a 33 percent increase. Biomass gained somewhat, from 4.3 to 4.4 quads in 2011, with solar energy increasing as well from 0.11 to 0.16 quads. Nuclear-generated electricity declined somewhat from 8.4 to 8.3 quads in 2011.
Simon notes that the western part of the U.S., where most hydroelectric plants are located, experienced significant rainfall during 2011, which kept reservoirs full and power plants able to generate more electricity. The increase in wind energy, says Simon, is due to many new wind farms coming online during the year.

U.S. energy accounting flow chart; click on image for full-size display (Lawrence Livermore National Laboratory)
Read more:
- Study Takes Down Renewable Energy Myths in the U.S. South
- National Lab: U.S. Energy, Fossil Fuels Use Up in 2010
- U.S. Using More Renewables, but Less Energy Overall
* * *


 RSS - Posts
You must be logged in to post a comment.