


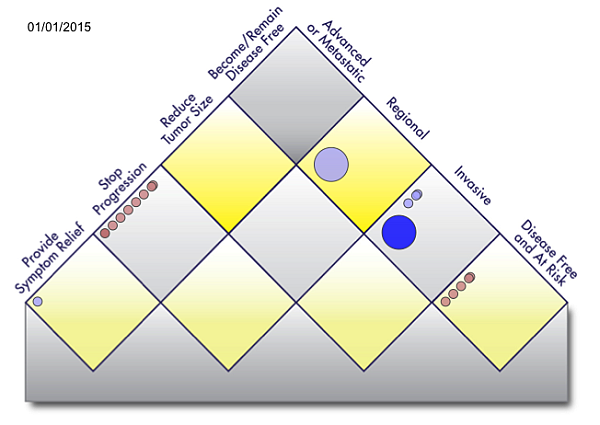
Value matrix for melanoma. Treatment goal is arrayed on the left axis and disease state on the right. Circles in each cell indicate treatments, showing their strength of evidence and availability. (Rose Li and Associates)
29 January 2015. Researchers in public health and cancer medicine developed statistical tools that capture findings on cancer treatments and care, and provide indicators of progress in defeating the disease. A team from Lilly Oncology — with colleagues from the U.S., Germany, U.K., and Italy — published its findings about the Continuous Innovation Indicators initiative earlier this month in the online journal eCancer.
Continuous Innovation Indicators is a project of Patient Access to Cancer care Excellence or PACE to collect research evidence on cancer treatments and present the data in a common format for patients, physicians, public health authorities, academics, and policy makers. The results aim to help stakeholders understand and describe the current state of progress against 12 types of cancer. PACE is funded by Lilly Oncology, a division of the pharmaceutical company Eli Lilly and Company.
Data collected for Continuous Innovation Indicators come from scientific literature reporting on the efficacy of cancer treatments. The data are systematically evaluated and rated by trained coders for the strength of the evidence offered, based on the rigor of the study and therapeutic goals. The evaluated studies cover 12 types of tumors: breast, colon, uterine (endometrium), kidney, liver, lung, pancreas, prostate, skin (melanoma), stomach, rectum, and testicular
An algorithm weighs strength of evidence along with value returned to shareholders, and computes standard evidence scores, or E-scores, measuring cumulative progress against cancer over time. The results are arrayed visually on a summary rating chart called a three-dimensional value matrix, with availability and evidence strength presented in color codes for each treatment goal and disease state. E-scores then track progress of the treatments over time, with each new piece of supporting evidence raising the E-score for that treatment.
Continuous Innovation Indicators data are stored in an online database hosted by Rose Li and Associates, a consulting firm in Bethesda, Maryland that contributed to the eCancer paper. The database makes it possible to search the database for the value matrix of treatments on each of the 12 types of tumors, and simultaneously compare up to 4 tumor types.
An infographic tells more about PACE and Continuous Innovation Indicators.
Read more:
- Analytics, Genomics Companies Partner on Cancer Therapies
- Small Business Contract to Fund Cancer Drug Response Tests
- Trial Crowdsources Lung Cancer Biomarker Screening
- Quest, Sloan Kettering Partner on Solid Tumor Diagnostics
- Ohio State, Cancer Center Partner on Research Database
* * *
 RSS - Posts
You must be logged in to post a comment.