


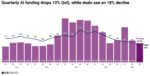
According to CB Insights, venture investments in A.I. are declining each quarter in 2023, with the number of venture deals reaching a low level not seen since 2017. . . . → Read More: Infographic: A.I. Getting Hype, But Fewer Venture Funds
|
|||||
|
|
According to CB Insights, venture investments in A.I. are declining each quarter in 2023, with the number of venture deals reaching a low level not seen since 2017. . . . → Read More: Infographic: A.I. Getting Hype, But Fewer Venture Funds 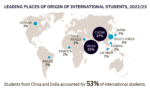
China and India provided more than half of all international students at U.S. universities in the last academic year, as total enrollment from overseas approached pre-pandemic levels. . . . → Read More: Infographic – China, India Continue as Top Student Sources 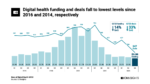
Venture funding for digital health start-ups continued heading down in the third quarter of 2023, reaching low levels not seen in almost a decade. . . . → Read More: Infographic – Digital Health Funding Continues Slide 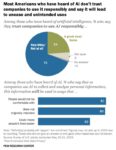
A poll in the U.S. shows a large majority of Americans who heard of artificial intelligence have very little or no trust that companies will use the technology responsibly. . . . → Read More: Infographic – Little Trust in Companies’ A.I. Use 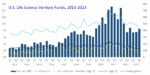
Venture investments in U.S. life science and biotechnology start-ups in the third quarter of 2023 rose from the previous two quarters to reach pre-pandemic levels. . . . → Read More: Infographic – Q3 Life Science Venture Funds Tick Up 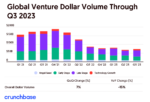
Global venture investment dollars in the third quarter of 2023 rose somewhat from the previous quarter, but remained at about the same level for the past 12 months. . . . → Read More: Infographic – Global Q3 Venture Funding Levels Off 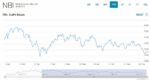
The Nasdaq Biotechnology Index, an indicator of investor sentiment in an industry based on science, continued heading down during the third quarter of 2023. . . . → Read More: Infographic – Biotech Index Continues Downward Trend 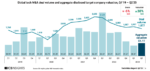
The value of mergers and acquisitions in the global technology sector rose for the first time in over a year in the second quarter of 2023, while M&A deal counts dropped somewhat. . . . → Read More: Infographic – Q2 Tech Merger Values Up, Deals Down 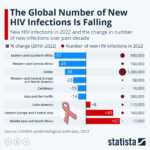
The number of new infections from the human immunodeficiency virus or HIV declined worldwide last year and over the past decade, with the sharpest declines in sub-Saharan Africa. . . . → Read More: Infographic – HIV Infections Fall in Africa. Rise in Mideast, Europe 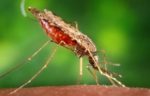
A company creating a digital process to monitor farm insect pests is receiving funds to expand its technology for tracking and counting mosquitoes as a general public health threat. . . . → Read More: Small Biz Award Funds A.I. Mosquito Monitoring System |
||||
|
Copyright © 2024 Technology News and Literature - All Rights Reserved Powered by WordPress & Atahualpa |
|||||
 RSS - Posts