


We will look at the main factors and classifications of risks associated with conducting business activities on the world stage. . . . → Read More: How can international business risks be overcome?
|
|||||
|
|
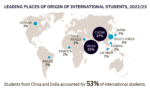
China and India provided more than half of all international students at U.S. universities in the last academic year, as total enrollment from overseas approached pre-pandemic levels. . . . → Read More: Infographic – China, India Continue as Top Student Sources 
A company offering a biomanufacturing process it says is more efficient and scalable than conventional bio-production methods is raising $9.5 million in its first venture round. . . . → Read More: Biomanufacturing Company Gains $9.5M in Early Funds 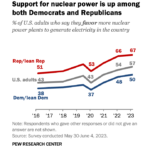
As the climate crisis focuses more attention on alternatives to fossil fuels, nuclear energy is gaining more popular support in the U.S. as one of those alternatives. . . . → Read More: Infographic – Nuclear Power Support Grows in U.S. 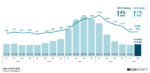
Since the start of 2021, most news has been gloomy about venture investments, but a report last week suggests corporate venture capital funding worldwide is picking up. . . . → Read More: Infographic – Some Good Corporate Venture Fund News 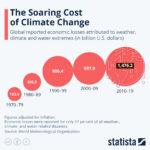
In the last three decades, according to the analysis, the economic burden jumped markedly from before, rising to nearly $1.5 trillion worldwide in the years 2010 to 2019. . . . → Read More: Infographic – Growing Climate Crisis Economic Burden 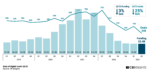
Global venture funding for digital health start-ups remains mired at low levels, as the number of investment deals in the second quarter of 2023 dropped to its lowest level in eight years. . . . → Read More: Infographic – Digital Health Venture Funds Remain Stuck 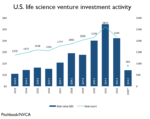
Investments in life science start-ups in the U.S. show continued declines into the second quarter of 2023, reaching levels not seen in four or five years. . . . → Read More: Infographic – U.S. Life Science Venture Activity Keeps Falling 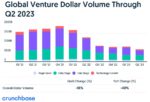
Venture capital funding for start-ups worldwide continued dropping in the second quarter of 2023 with dollar volumes down by double digits from just the first quarter of the year. . . . → Read More: Infographic – Venture Funds Continue Slide in Q2 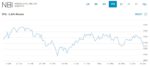
The Nasdaq Biotechnology Index, an indicator of investor sentiment in science-based businesses, bounced back from its 2023 low point, but still ended down slightly for the year on 30 June. . . . → Read More: Infographic – Biotech Index Shows Life, Ends Flat This Year |
||||
|
Copyright © 2024 Technology News and Literature - All Rights Reserved Powered by WordPress & Atahualpa |
|||||
 RSS - Posts