


(DoDLive.mil)
20 April 2016. Energy use by Americans in their homes and businesses declined in 2015 from the previous year, due to a sharp drop in coal burned for electric power, among other factors. The findings were published in an annual accounting of national energy supply and demand by Lawrence Livermore National Laboratory, based on data from the Department of Energy’s Energy Information Administration.
Overall, Americans used 97.5 quadrillion British Thermal Units, or quads, of energy, a reduction of 0.8 quads from 2014. British Thermal Units or BTUs are an international unit of energy, with 3,600 BTUs equivalent to 1 kilowatt-hour. At the same time, Americans use of energy from renewable sources increased in 2015, led by gains of 25 percent in utility-scale solar energy, and 11 percent more use each of residential solar and geothermal power. Use of wind energy also gained by 5 percent in 2015.
While renewables gained, fossil fuel use had a mixed record in 2015. Burning of coal for electrical power declined by 12 percent in 2015 to 15.7 quads, while natural gas use increased by 3 percent, reflecting a continuing shift in sources by utilities. A.J. Simon, group leader of the Livermore Lab’s energy program, notes in a statement that “much of the overall decrease in energy consumption can be traced to the shift from coal to gas, because modern gas-fired plants may use up to 46 percent less energy to produce the same amount of electricity.”
Petroleum use in 2015 increased by 2 percent compared to 2014, which Livermore Lab says is a result of economic growth, reflected in more driving for work and recreation, as well as increased deliveries of goods. Energy produced from all sources for electric power generation decreased slightly to 38 quads in 2015.
The largest single energy consumer in the U.S. in 2015 was transportation, which accounted for 27.7 of the 97.5 quads produced, about the same as 2014, followed by industrial, residential, and commercial uses. Residential, commercial, and industrial energy use in 2015 registered decreases compared to 2014, with residential use of natural gas declining by 0.5 quads in 2015, which Livermore Lab attributes to milder winter.
Wasted energy — power produced but not consumed by the economy — declined from 59.4 quads in 2014 to 59.1 in 2015, a reduction of 1 percent. Livemore Lab attributes at least some of that wasted energy reduction to more efficient electrical power production, including utility-scale solar farms.
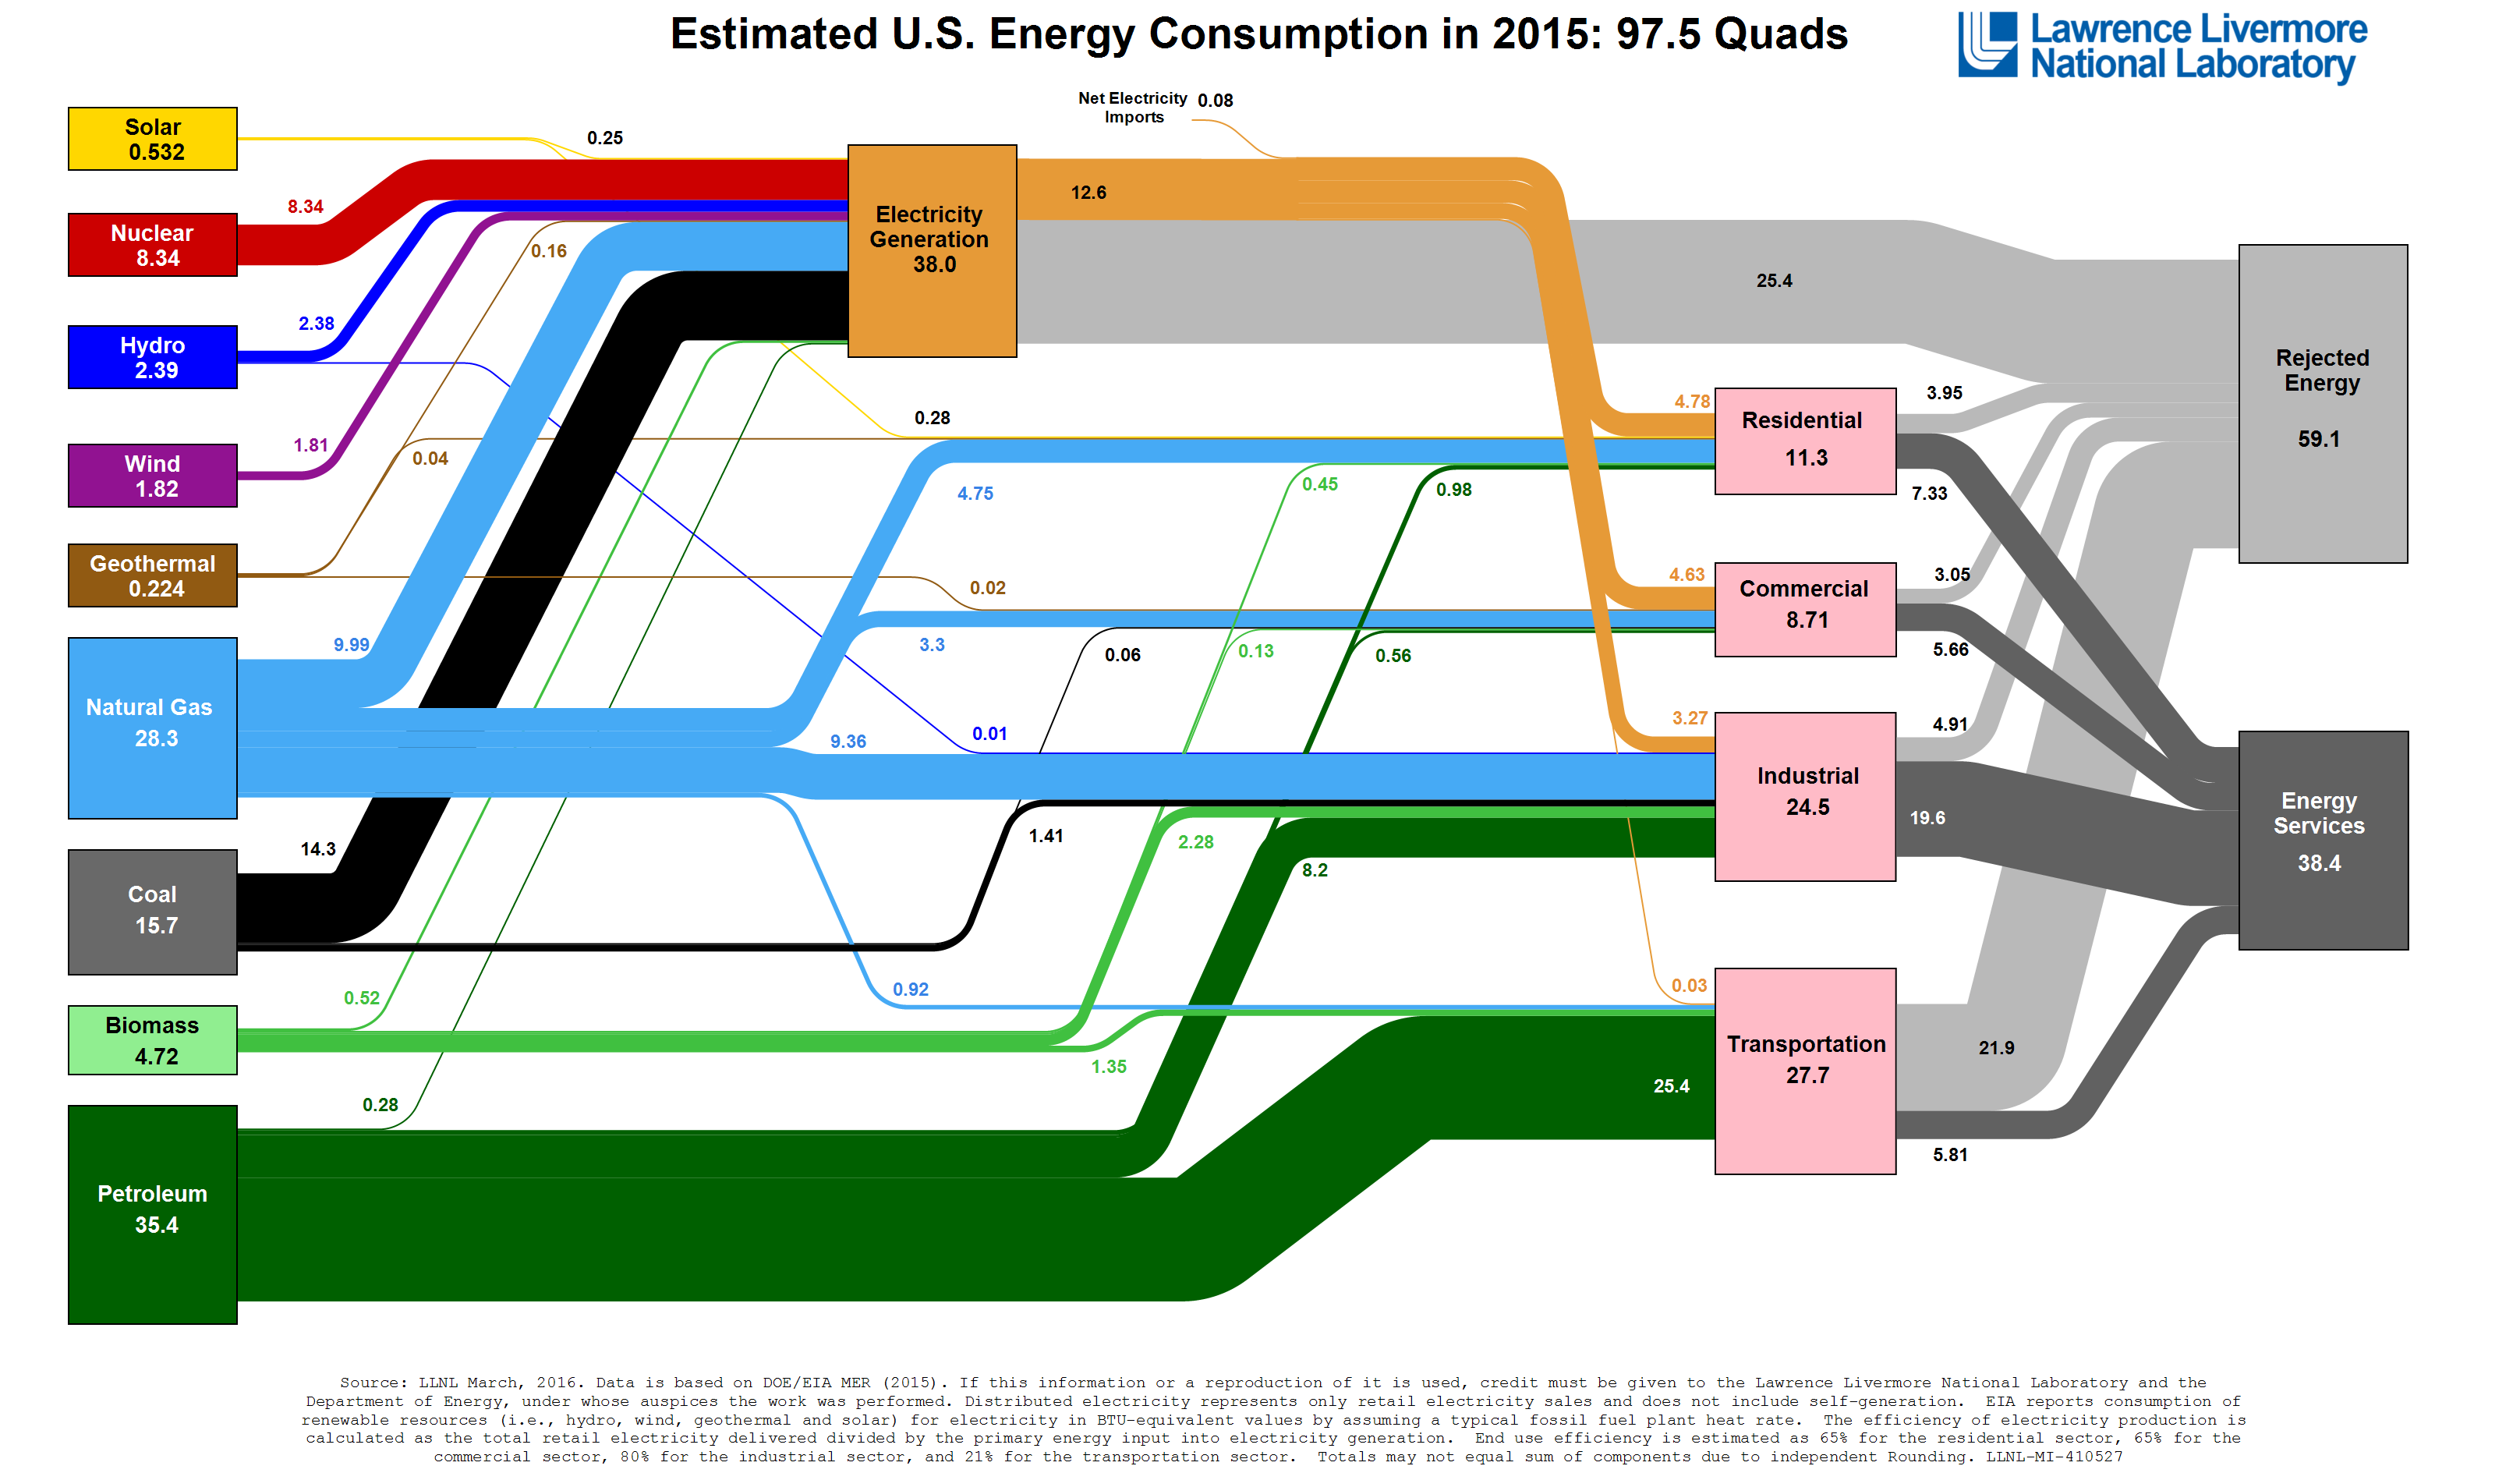
U.S. energy accounting flow chart; click on image for full-size display (Lawrence Livermore National Laboratory)
Read more:
- What it Takes to Innovate in the Old Economy
- €50,000 Challenge Seeks New Gas Technologies
- Governments, Private Investors Unveil Clean Energy Plans
- ARPA-E Funding 41 Energy Generation, Efficiency Projects
- Navy Seeks Graphene Nanoribbons for Electricity Distribution
* * *
 RSS - Posts
You must be logged in to post a comment.