


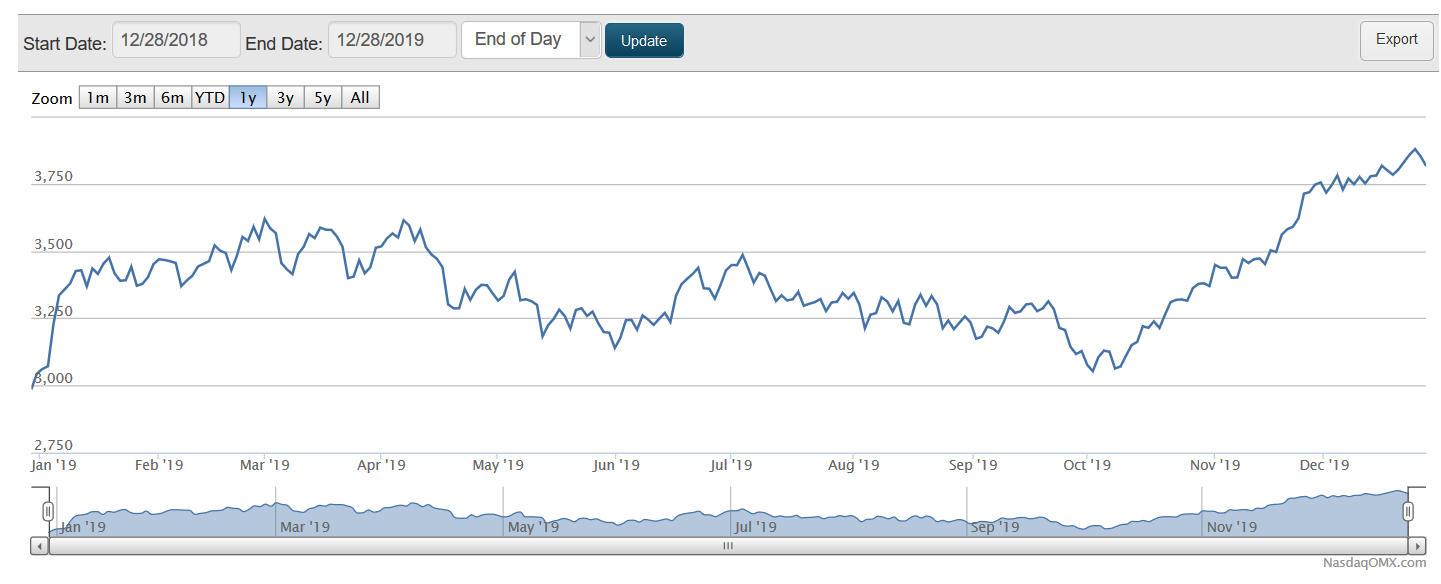
Nasdaq Biotechnology Index, 28 Dec. 2018 through 27 Dec. 2019. Click on image for full-size view (Nasdaq)
28 Dec. 2019. When we last checked in with the Nasdaq Biotechnology Index in mid-October, the NBI had fallen from its high point for the year about six months earlier to about the same level as early January 2019. Since October, however, the NBI rose steadily to a new high for the year, as shown in this weekend’s infographic.
NBI is an index of 223 biotech companies trading on the Nasdaq exchange, where many public technology companies of all kinds trade their shares. The year 2019 began with NBI in a slump, hovering just about 3,000. By March, the index rose 19 percent to 3,619 and bounced around that level through mid-April, then began a decline to 3,053, about where it began the year.
Beginning in October, however, NBI reversed course, rising continuously over the next three months. Yesterday, the index closed at 3,851, a gain of 807 points or 26.5 percent from 2 January. That year-long increase is not far behind the overall Nasdaq composite index that rose 35 percent from the beginning of 2019.
We noted in October a few hints that biotech company shares may take off, with the sector remaining a hot investment target for venture capital through the third quarter of 2019. We should see soon if venture investors continue that pattern in the fourth quarter of the year.
More from Science & Enterprise:
- Two Biotechs Each Issue $300M+ IPOs
- Genome Editing Biotech Raises $126M in IPO
- Infographic – Tech IPOs Flat in 2018
* * *
 RSS - Posts
You must be logged in to post a comment.