


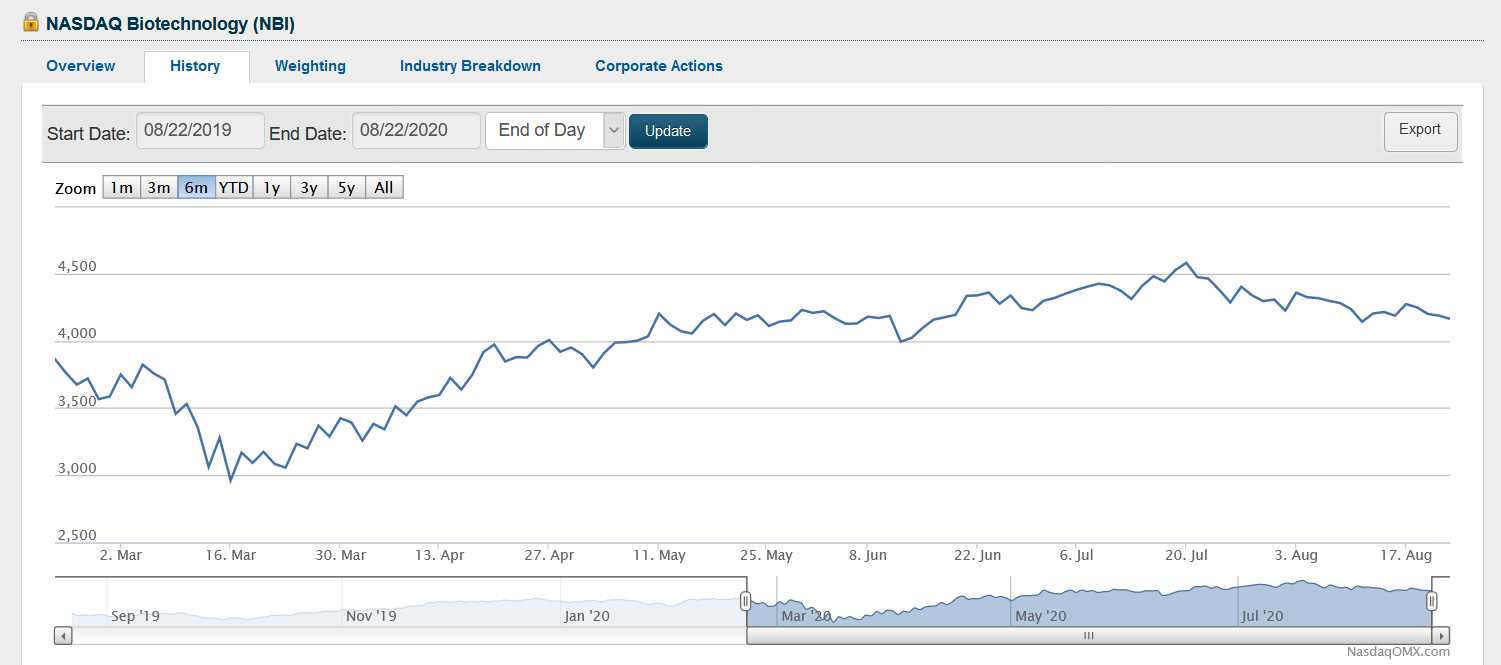
Nasdaq Biotechnology Index, 21 Feb. through 21 Aug 2020. Click on image for full-size view (Nasdaq)
22 Aug. 2020. We last looked at the Nasdaq Biotechnology Index in April, and it’s time to check in again with this financial indicator of the index. In April, we saw how the NBI, an index of 206 biotech companies listed on the Nasdaq exchange, began rebounding from the pandemic shock in March, with the likely realization among investors that biotech companies will be at the center of any solutions to Covid-19.
Since April, NBI continued rising until 20 July, when it closed at nearly 4,580, more than 1.5 times its 16 March trough. Since 20 July, the index declined somewhat to yesterday’s close of 4,162. Looking back to May, however, shows that NBI has largely settled in to the 4,000 to 4,500 range, without volatile swings in either direction. The overall Nasdaq Composite Index, an indicator of the technology industry in general, has gained steadily since April, closing yesterday at 11,311, its high point for the year.
As we reported last month, life science and biotech start-ups remained hot venture targets during the first half of 2020, in spite of the pandemic, or maybe because of it. We will see if this investor preference continues, or the mild decline in the NBI since last month is the start of a longer-term trend.
More from Science & Enterprise:
- Venture Fund Plans $350M for Biotech Start-Ups
- Investment Funds Named for Underserved Entrepreneurs
- Early Venture Investors Aim for Diverse Entrepreneurs
* * *
 RSS - Posts
You must be logged in to post a comment.