


This post lists the major tax forms a business owner should consider while preparing tax information. . . . → Read More: Types of Tax Forms for Businesses
|
|||||
|
|
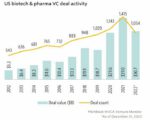
Venture funds for new U.S. biotechnology and pharmaceutical companies declined from historical highs in 2022, but a closer look reveals even more signs of financial tightening. . . . → Read More: Infographic – 2022 Biotech Venture Funding Weakens 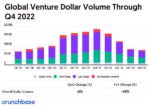
Total venture funds invested fell each quarter in 2022, from $163.1 billion in Q1 to $77.2 billion in Q4, which suggests continued declines into 2023. . . . → Read More: Infographic – Mixed Signals on 2022 Venture Funding 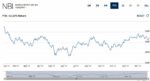
NBI is showing signs of life, rising somewhat from its low point for the year and since the end of the third quarter, but still down almost 12 percent since the start of the year. . . . → Read More: Infographic – Biotech Index Struggles to Regain Ground 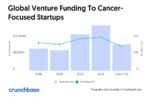
Funding for new enterprises creating products and services that treat or detect cancer fell more than 40 percent from last year. . . . → Read More: Infographic – Cancer Start-Up Venture Funds Decline 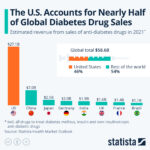
More than 133 million people have diabetes, nearly one-third of the world’s total, yet almost half of the world’s diabetes drug sales volume is in the U.S. . . . → Read More: Infographic – U.S. Dominates Diabetes Drug Sales 
A start-up enterprise seeks to make drugs for treating rare diseases more readily available to physicians and patients in Europe. . . . → Read More: Company to Boost Orphan Drugs in Europe 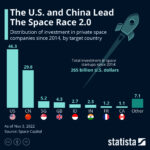
Data collected by Space Capital, a venture investor in companies developing space-based technologies, shows $265 billion invested in these start-up companies since 2014. . . . → Read More: Infographic – US, China Lead in Space Investments 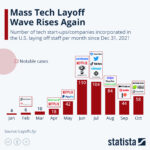
Layoffs by U.S. technology companies are becoming more common, particularly in the second half of this year. . . . → Read More: Infographic – U.S. Tech Layoffs This Year 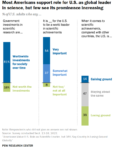
Most Americans believe the U.S. should be the world leader in scientific achievement, and support continued U.S. government investments in science. . . . → Read More: Infographic – US Public Supports Govt Science Spending |
||||
|
Copyright © 2024 Technology News and Literature - All Rights Reserved Powered by WordPress & Atahualpa |
|||||
 RSS - Posts