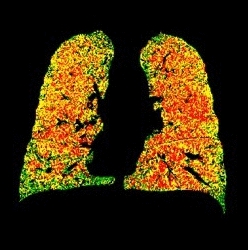
Medical researchers at University of Michigan in Ann Arbor adapted computed tomography (CT) image analysis techniques to more precisely diagnose chronic obstructive pulmonary disease, or COPD. The research team led by Michigan radiologist Brian Ross appears online in the journal Nature Medicine (paid subscription required). Ross and colleagues also founded a company that is taking the technology to market.
CT scans are a type of X-ray that makes it possible to generate cross-sectional and 3-D images of organs, including the lungs. Ross and co-author Alnawaz Rehemtulla developed a technique called parametric response mapping that analyzes quantifies changes in CT scan images down to the individual voxel (volumetric pixel or picture element). Ross and Rehemtulla previously applied parametric response mapping to MRI images, to diagnose minute changes in brain tumors that before escaped notice.
In this research, Ross and colleagues applied parametric response mapping to CT images of lungs of 194 people with COPD, a progressive disease that makes it hard to breathe, and marked by coughing, wheezing, shortness of breath, chest tightness, and reduced ability to exercise or walk. The patients in the study are part of the national COPDGene study that seeks to learn more about genetic causes of the disease, along with cigarette smoking, commonly associated with COPD.
Parametric response mapping overlays or registers the CT scans taken during a full inhalation with an image taken during a full exhalation. The registered CT images share the same geometric space, so that the lung tissue in the inflated and deflated lungs aligns. The density of healthy lung tissue will change more between the two images than the density of diseased lung tissue, allowing researchers to create a three-dimensional map of the patient’s lungs.
This mapping makes it possible assign colors to each voxel, generated by the difference in signal changes in each of the areas between the two scans. Green means healthy tissue, yellow means a reduced ability to push air out of the small sacs, and red means severely reduced respiratory ability (see image at top).
With parametric response mapping, the researchers were able to identify progressive subtypes of COPD, distinguishing between milder functional small airways disease and more serious emphysema. The analytical technique enabled the team to assign unique imaging biomarkers to the different types and stages of COPD. “We believe this offers a new path to more precise diagnosis and treatment planning,” says Ross, “and a useful tool for precisely assessing the impact of new medications and other treatments.”
Ross and Rehemtulla founded Imbio, a company now based in Minneapolis, that licensed parametric response mapping from the university and is commercializing the technology. Imbio is marketing parametric response mapping for more precisely diagnosing brain tumors and COPD. Ross and Rehemtulla serve as scientific advisers to the company.
Read more:
- Trial to Test Osteopathic Techniques to Treat COPD
- Low-Dose, High-Rez CT Scanning Technique Developed
- Imaging Technique Highlights Cardiac Arrest Candidates
- 4D Lung Imaging Technology Developed
- FDA Approves Portable Device to Spot Brain Bleeding
* * *


 RSS - Posts
[…] CT Image Analytics Adapted for COPD Diagnosis […]
[…] CT Image Analytics Adapted for COPD Diagnosis […]