


Click on image for full-size view. (Statista)
9 Dec. 2018. The report last week from the United Nations Environment Program shows carbon dioxide emissions worldwide are rising again after 3 years of stable or dropping CO2 levels. And that report comes soon after alarming findings from the Intergovernmental Panel on Climate Change, which notes that carbon emissions need to stop immediately to keep temperatures under the 1.5 degrees C targets and prevent permanent harm to the planet.
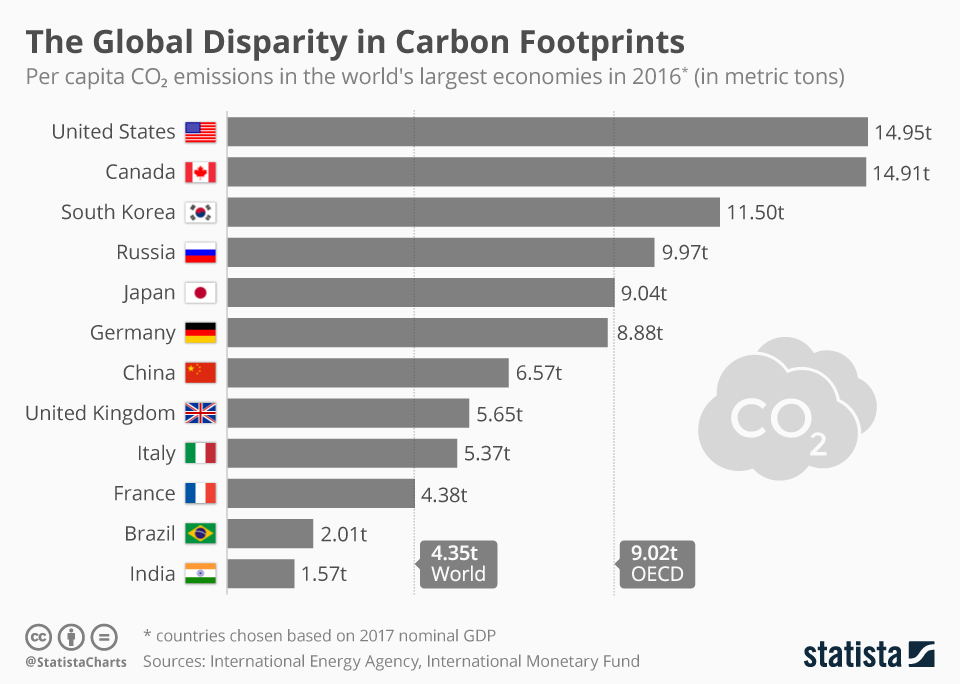
Both of these reports give a special urgency to the UN’s Climate Change Conference, known as COP24, now underway in Katowice, Poland. While the problem is global, remediating actions are taken by individual countries, and our friends at Statista offered last week a list of the CO2 emissions per capita for the world’s largest economies in 2016, this weekend’s infographic on Science & Enterprise. The results — from data offered by the International Energy Agency and International Monetary Fund — show the U.S. and Canada each emit nearly 15 metric tons of CO2 per person, leading the list of top national polluters.
Following the North American countries are South Korea and Russia, with emissions per capita greater than the OECD country average of 9.02 metric tons, then Japan and Germany at about the OECD average. China, the U.K., and Italy have emissions per capita lower than the OECD average, but still greater than the global mean of 4.35 metric tons. France registers at about the global level, while Brazil and India have lower per capita emissions than the worldwide average.
More from Science & Enterprise:
- Jet Fuel from Carbon Waste Powers Virgin Atlantic flight
- Infographic – Costs of Climate Change Soar
- Tech Industry Groups Blast Paris Accord Exit
* * *
 RSS - Posts
You must be logged in to post a comment.