


R&D expenditures to 2017 (NSF, Statista)
25 Jan. 2020. A new report from National Science Foundation shows China now ranks a close second to the U.S. in total research and development investments. Business data research company Statista compiled the numbers from the report earlier this week, displayed as our weekend infographic on Science & Enterprise.
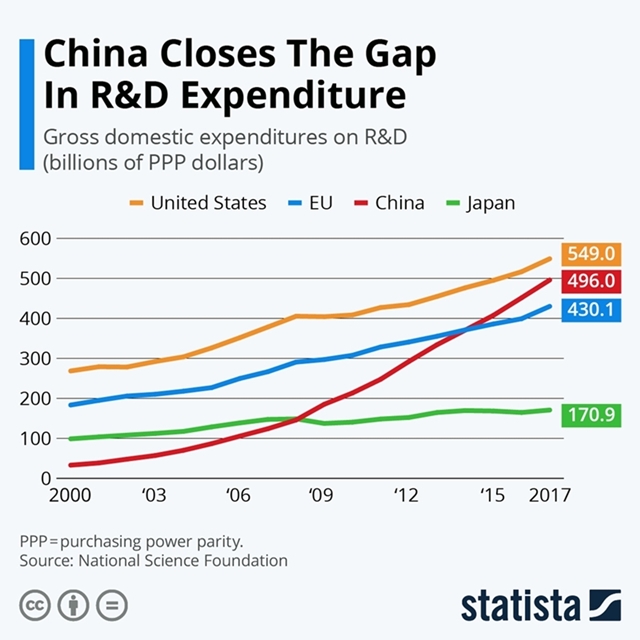
NSF’s biennial Science and Engineering Indicators report shows by 2017, the last year data are available, the U.S. still leads in total annual R&D expenditures at $549 billion, measured in purchasing power parity or PPP dollars, a macroeconomic measure of productivity that enables comparisons across countries and currencies. China, in second place behind the U.S., spent $496 billion in 2017, overtaking European Union countries with some $430 billion. Japan lags behind in fourth place with $171 billion.
The chart shows that since 2000, China’s R&D investments are on a steeper upward curve, increasing at an average of 17 percent a year, than the U.S., Europe, and Japan. In comparison, the U.S. annual growth rate is 4.3 percent. Businesses, says NSF, provide 70 percent of R&D spending in the U.S., while government expenditures add 10 percent.
More from Science & Enterprise:
- Infographic – China Top Country for Science Journal Papers
- Infographic – China Remains Top U.S. Student Source
- AstraZeneca Joins $1B Fund, Expands Footprint in China
* * *
 RSS - Posts
You must be logged in to post a comment.